Medical Image Analysis
Baiying Lei1 Yujia Zhao1 Zhongwei Huang1 Xiaoke Hao2 Feng Zhou3 Ahmed Elazab1 Jing Qin4 Haijun Lei1∗
1Shenzhen University 2Hebei University of Technology 3University of Michigan 4Hong Kong Polytechnic University

Fig. 1. Framework of our proposed method. First, we preprocess the original brain T1-weighted MRI image by the SPM. Then, we extract the tissue volume in the segmented regions with AAL. Then we calculate the corresponding tissue volume values as feature vectors. We fuse multi-tempalate features together by linear concatenation. We perform an adaptive feature selection combined with subspace learning to obtain the most discriminative features on the concatenated features. Finally, we use SVM with the sigmoid kernel to classify the samples into different groups.
Abstract
Neurodegenerative diseases are excessively affecting millions of patients, especially elderly people. Early detection and management of these diseases are crucial as the clinical symptoms take years to appear after the onset of neuro-degeneration. This paper proposes an adaptive feature learning framework using multiple templates for early diagnosis. A multi-classification scheme is developed based on multiple brain parcellation atlases with various regions of interest. Different sets of features are extracted and then fused, and a feature selection is applied with an adaptively chosen sparse degree. In addition, both linear discriminative analysis and locally preserving projections are integrated to construct a least square regression model. Finally, we propose a feature space to predict the severity of the disease by the guidance of clinical scores. Our proposed method is validated on both Alzheimer's disease neuroimaging initiative and Parkinson's progression markers initiative databases. Extensive experimental results suggest that the proposed method outperforms the state-of-the-art methods, such as the multi-modal multi-task learning or joint sparse learning. Our method demonstrates that accurate feature learning facilitates the identification of the highly relevant brain regions with significant contribution in the prediction of disease progression. This may pave the way for further medical analysis and diagnosis in practical applications.
1111MicrosoftInternetExplorer402DocumentNotSpecified7.8 磅Normal0
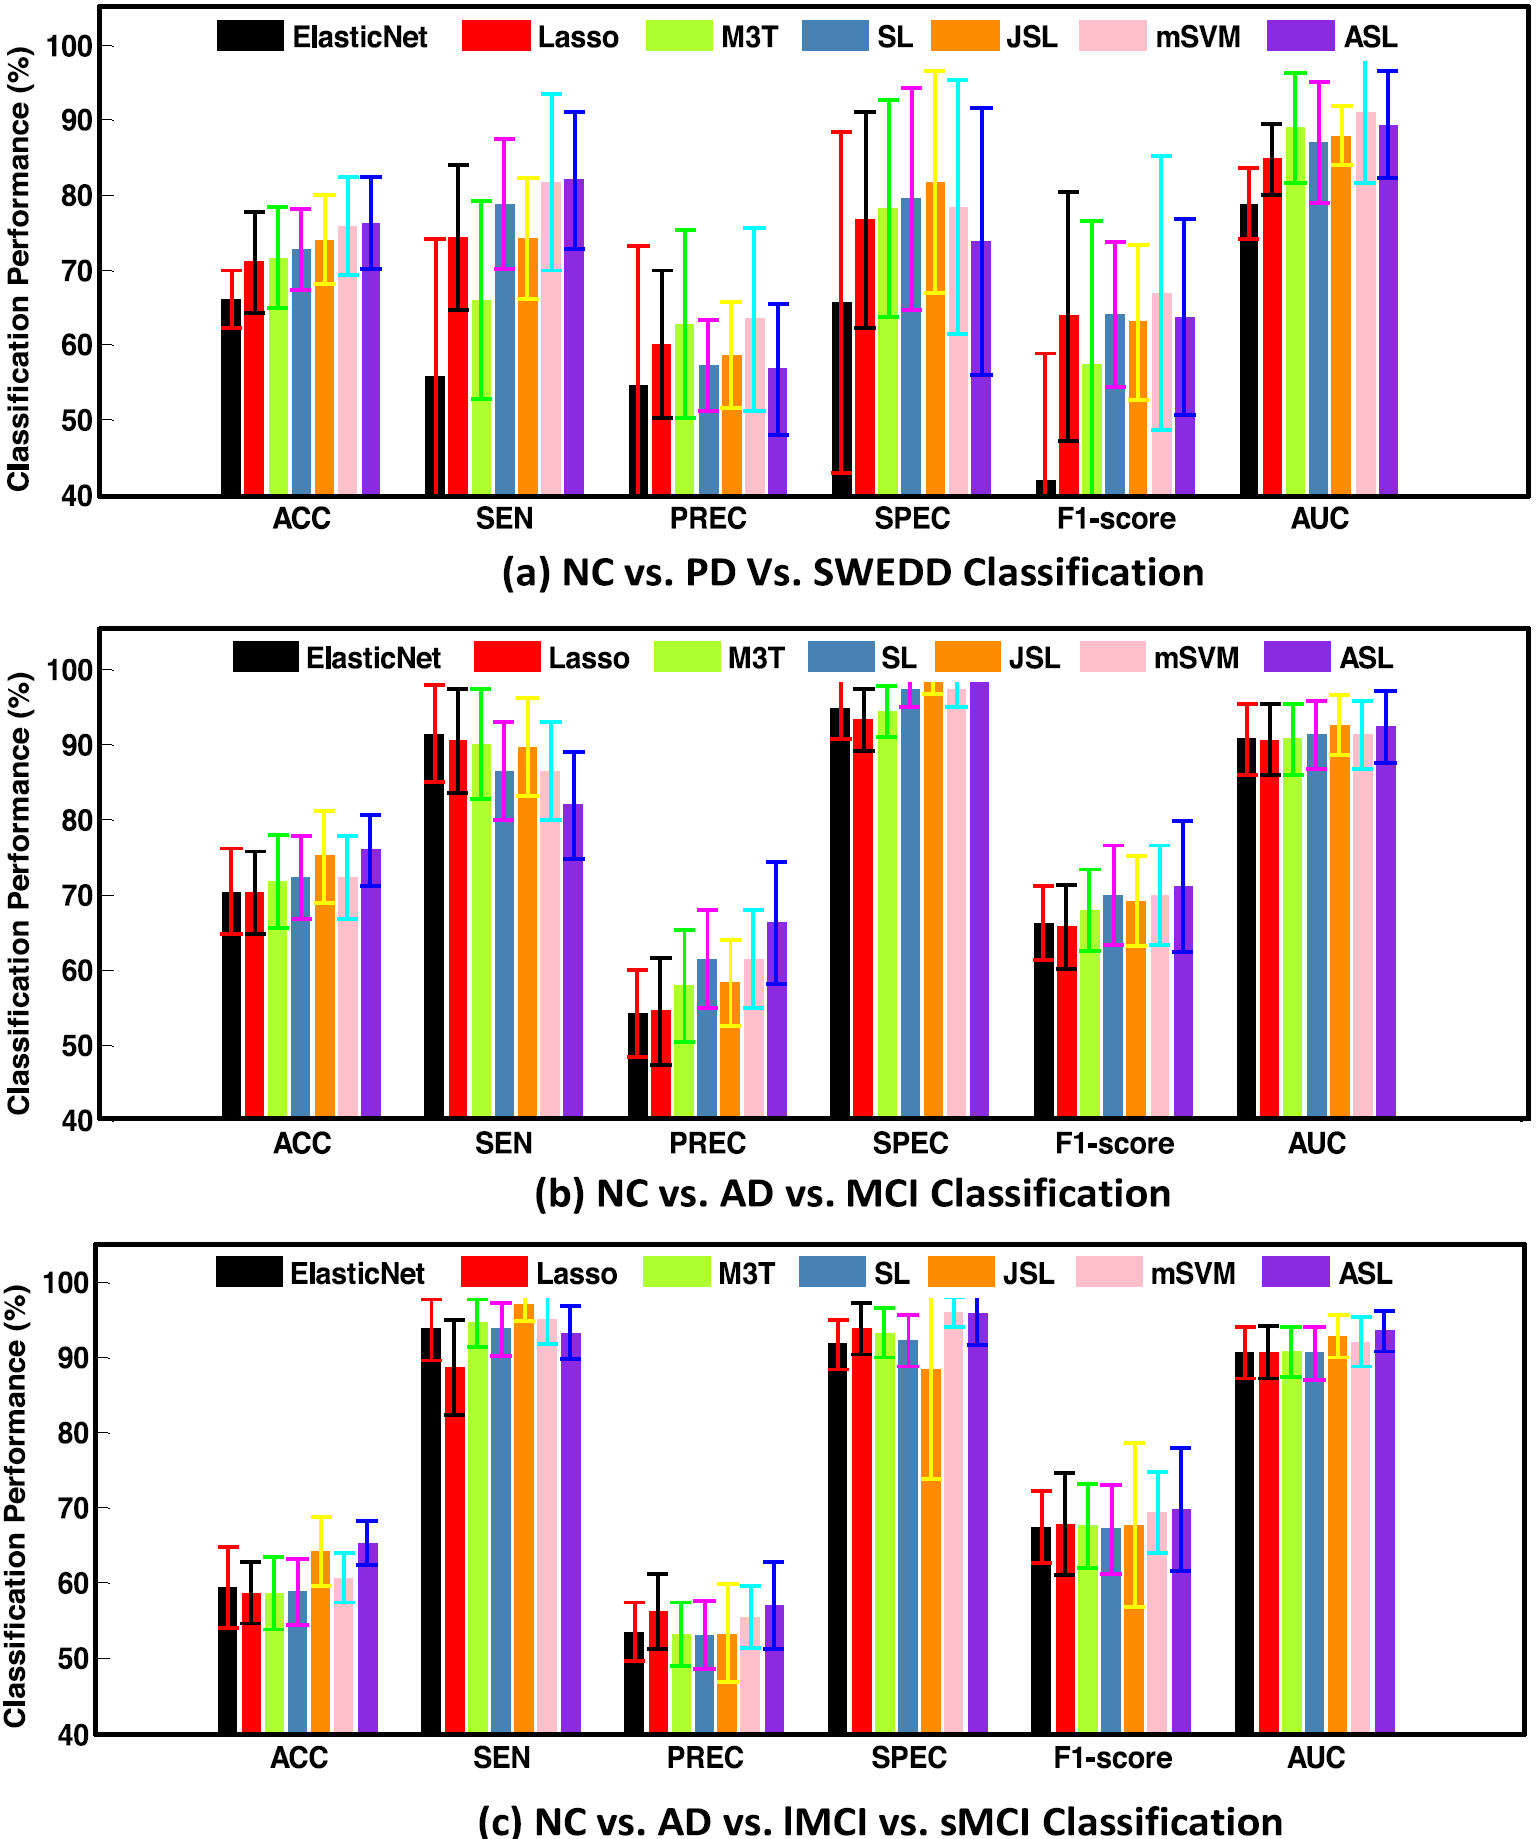
Fig. 2. Algorithm comparison performance via 90 segmented brain regions.
1111MicrosoftInternetExplorer402DocumentNotSpecified7.8 磅Normal0
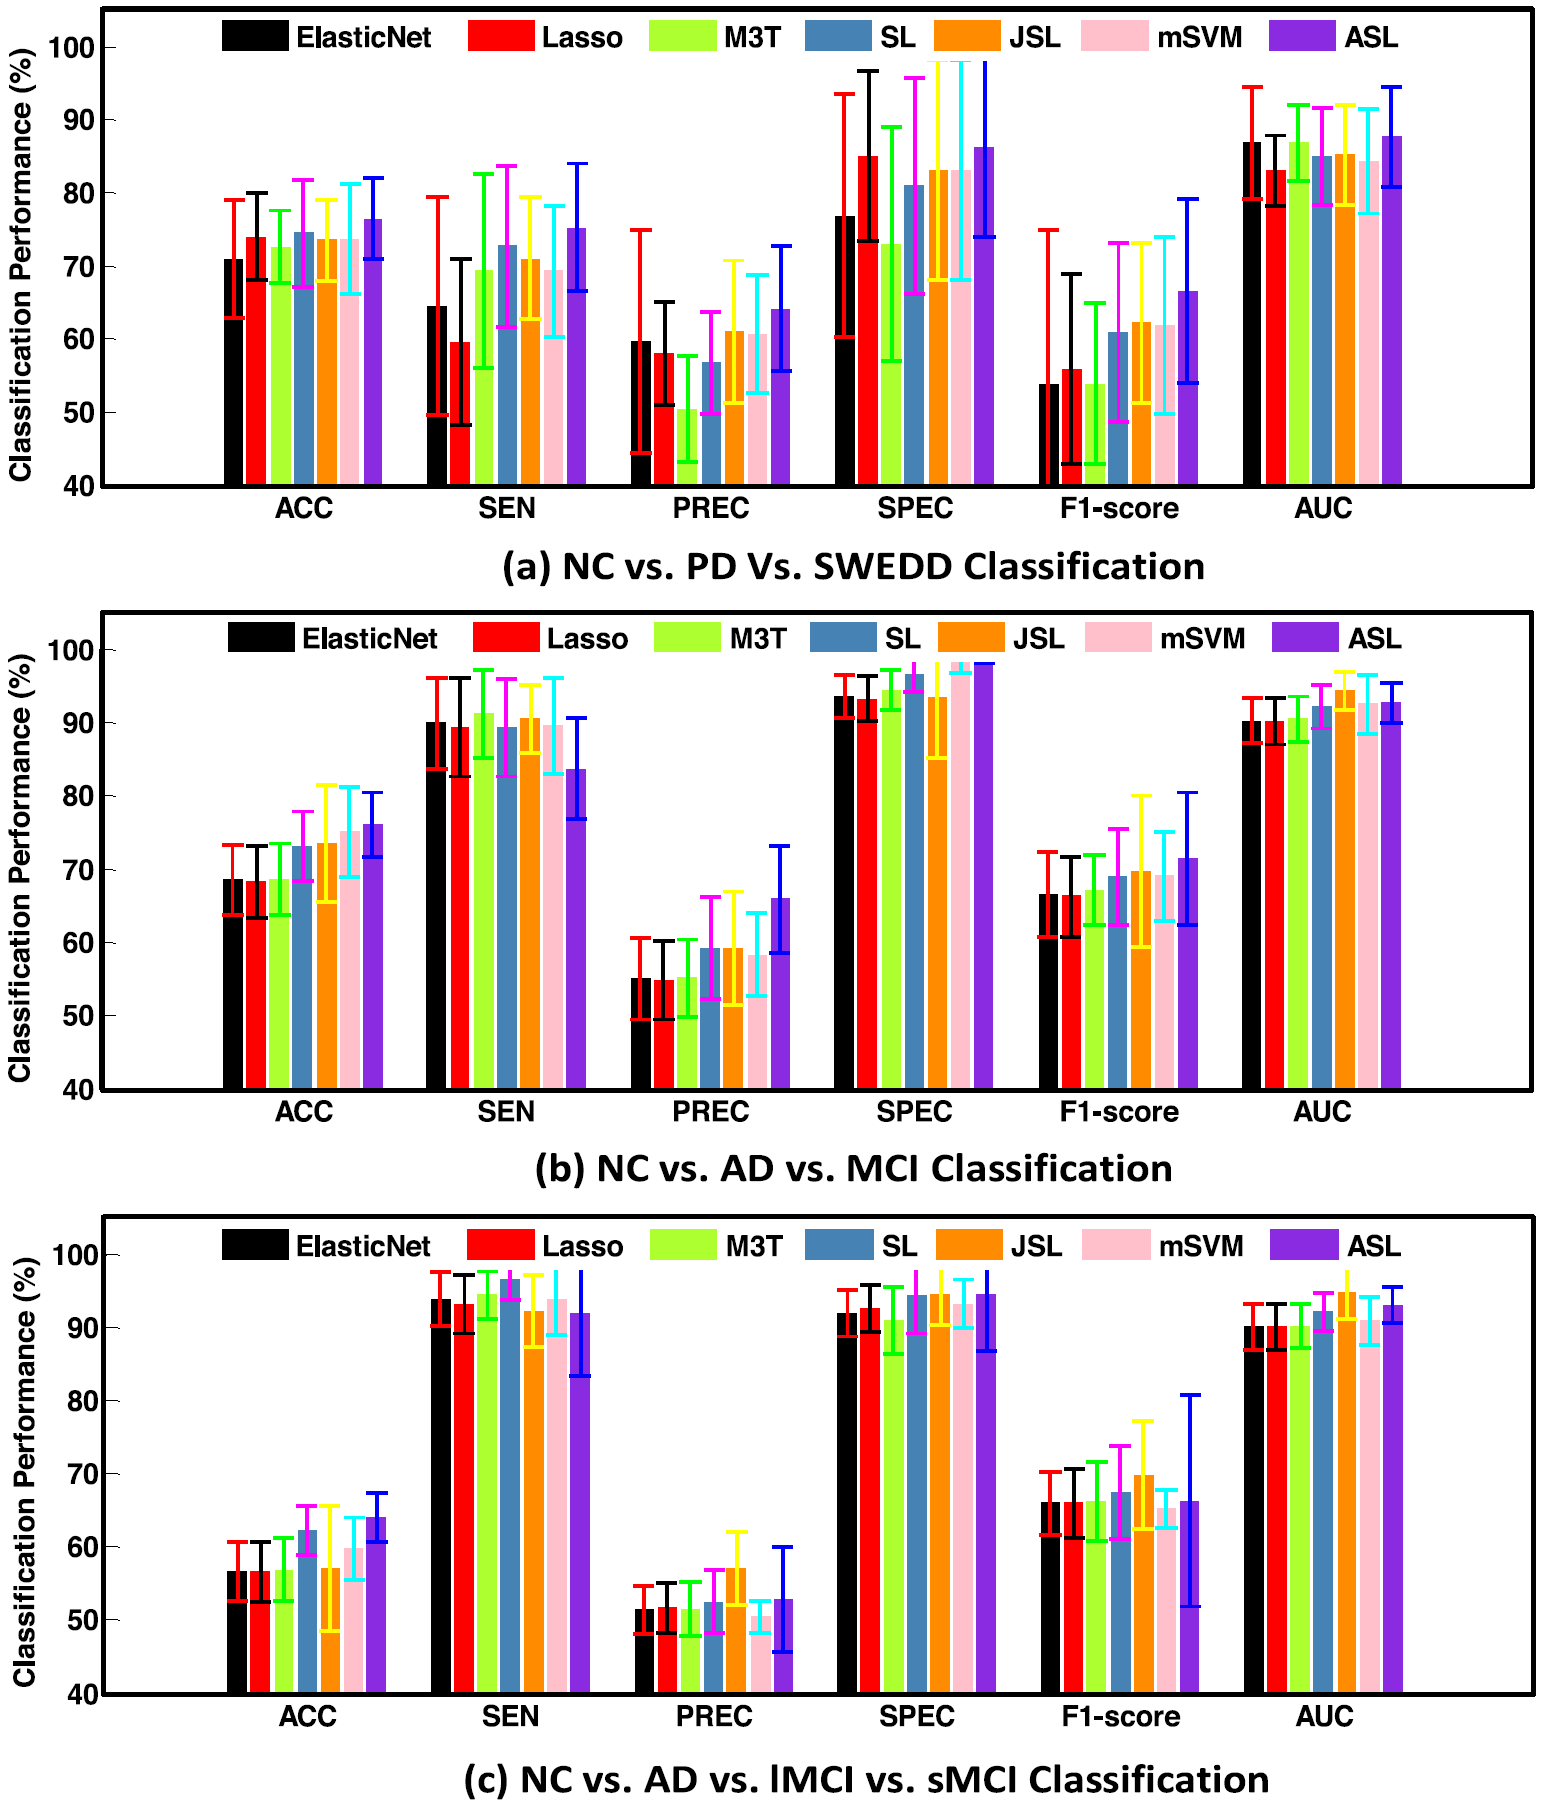
Fig. 3. Algorithm comparison performance via 116 segmented brain regions.
1111MicrosoftInternetExplorer402DocumentNotSpecified7.8 磅Normal0
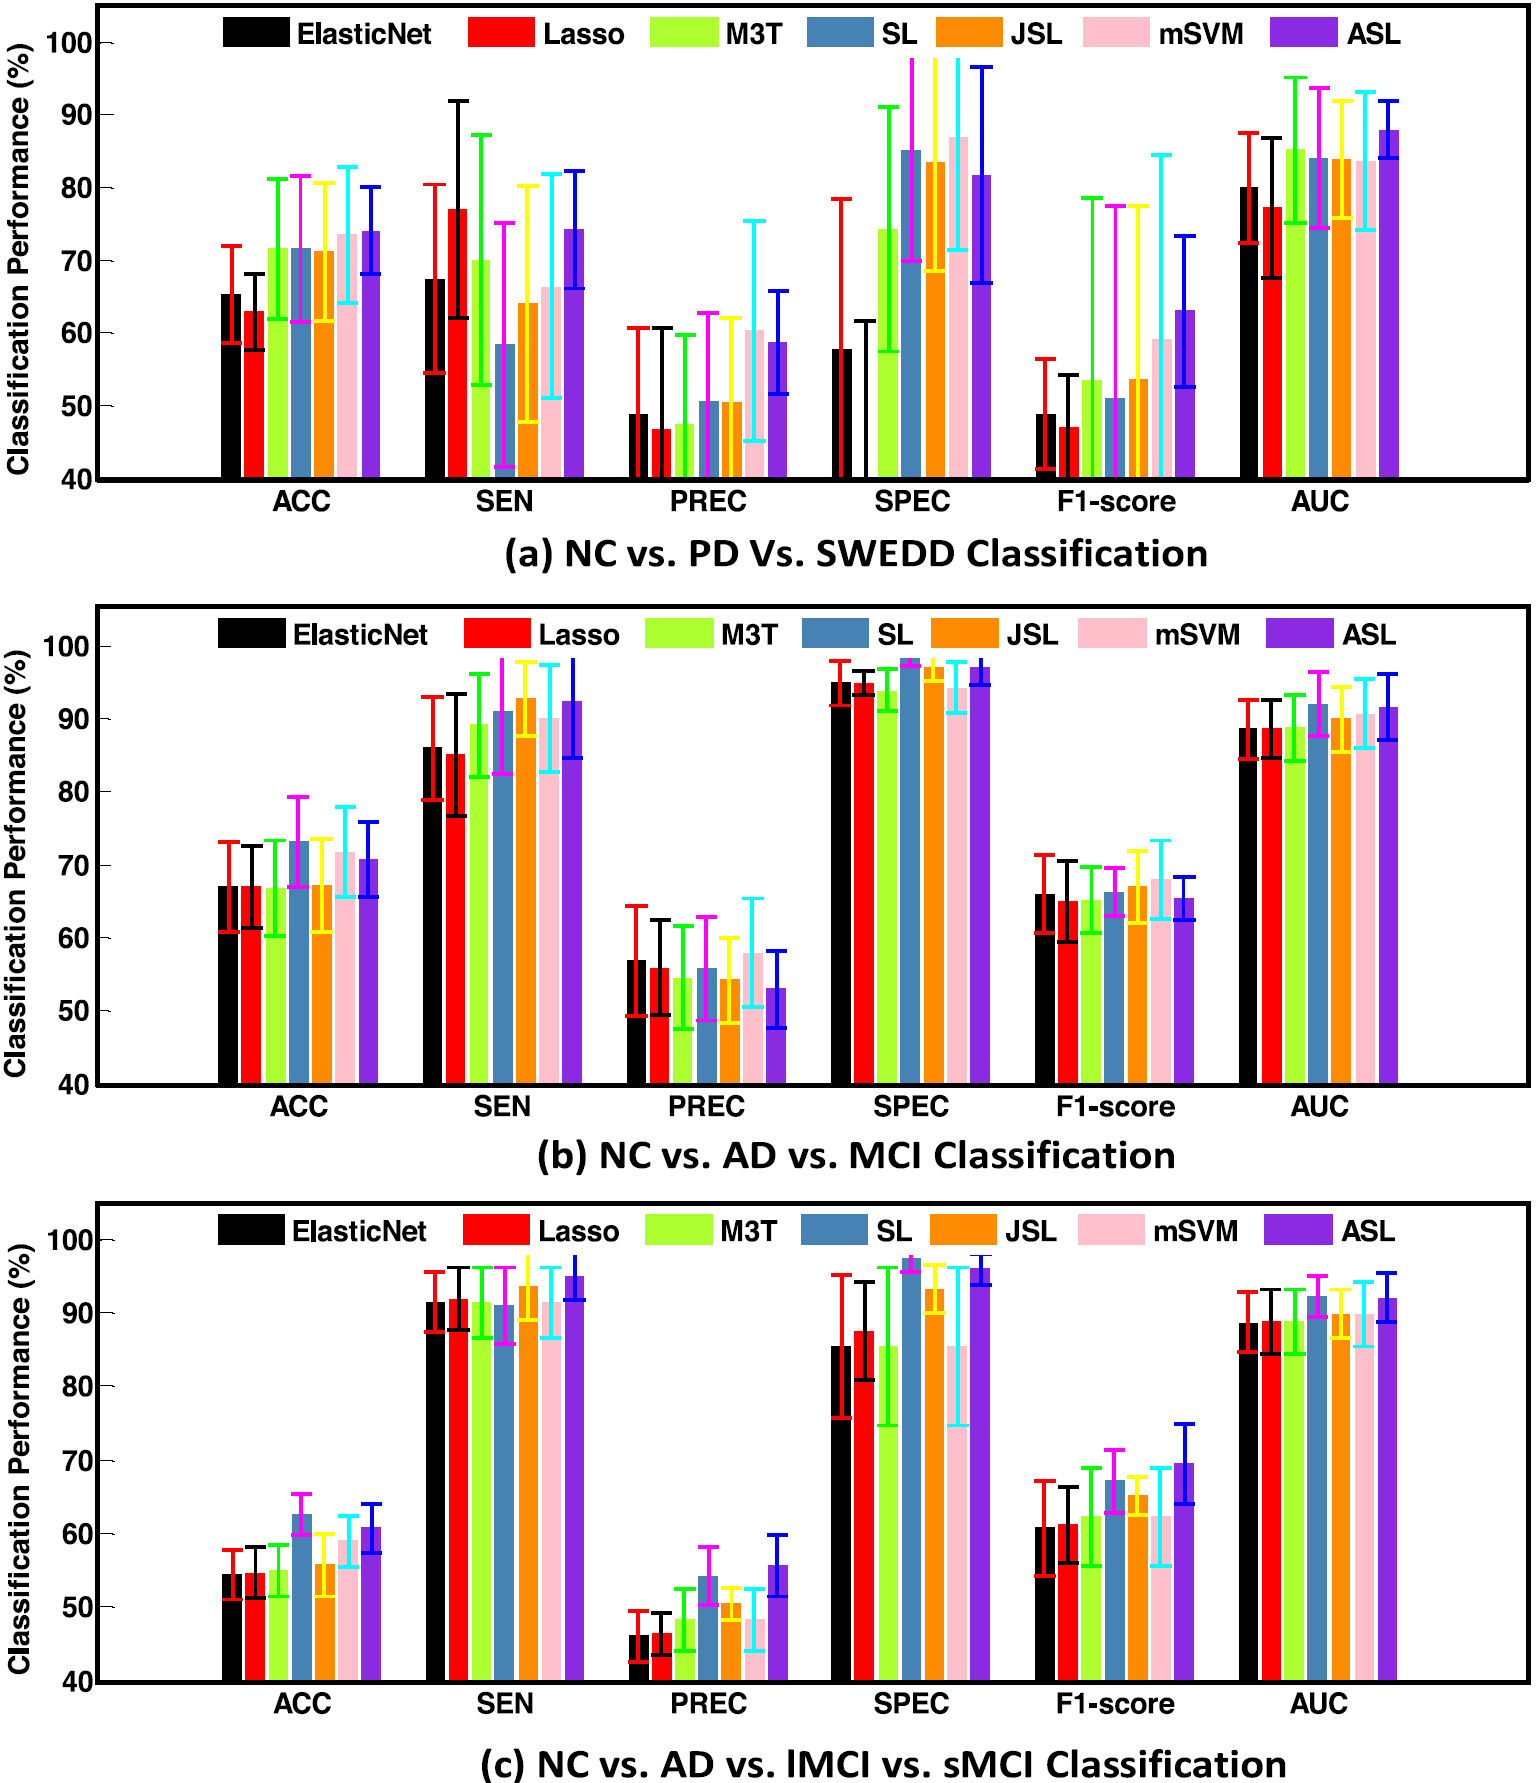
Fig. 4. Algorithm comparison performance via 200 segmented brain regions.

1111MicrosoftInternetExplorer402DocumentNotSpecified7.8 磅Normal0
1111MicrosoftInternetExplorer402DocumentNotSpecified7.8 磅Normal0
Fig. 6. ROC plots comparison of competing methods on different classification tasks using multi-ROIs fused features.
1111MicrosoftInternetExplorer402DocumentNotSpecified7.8 磅Normal0
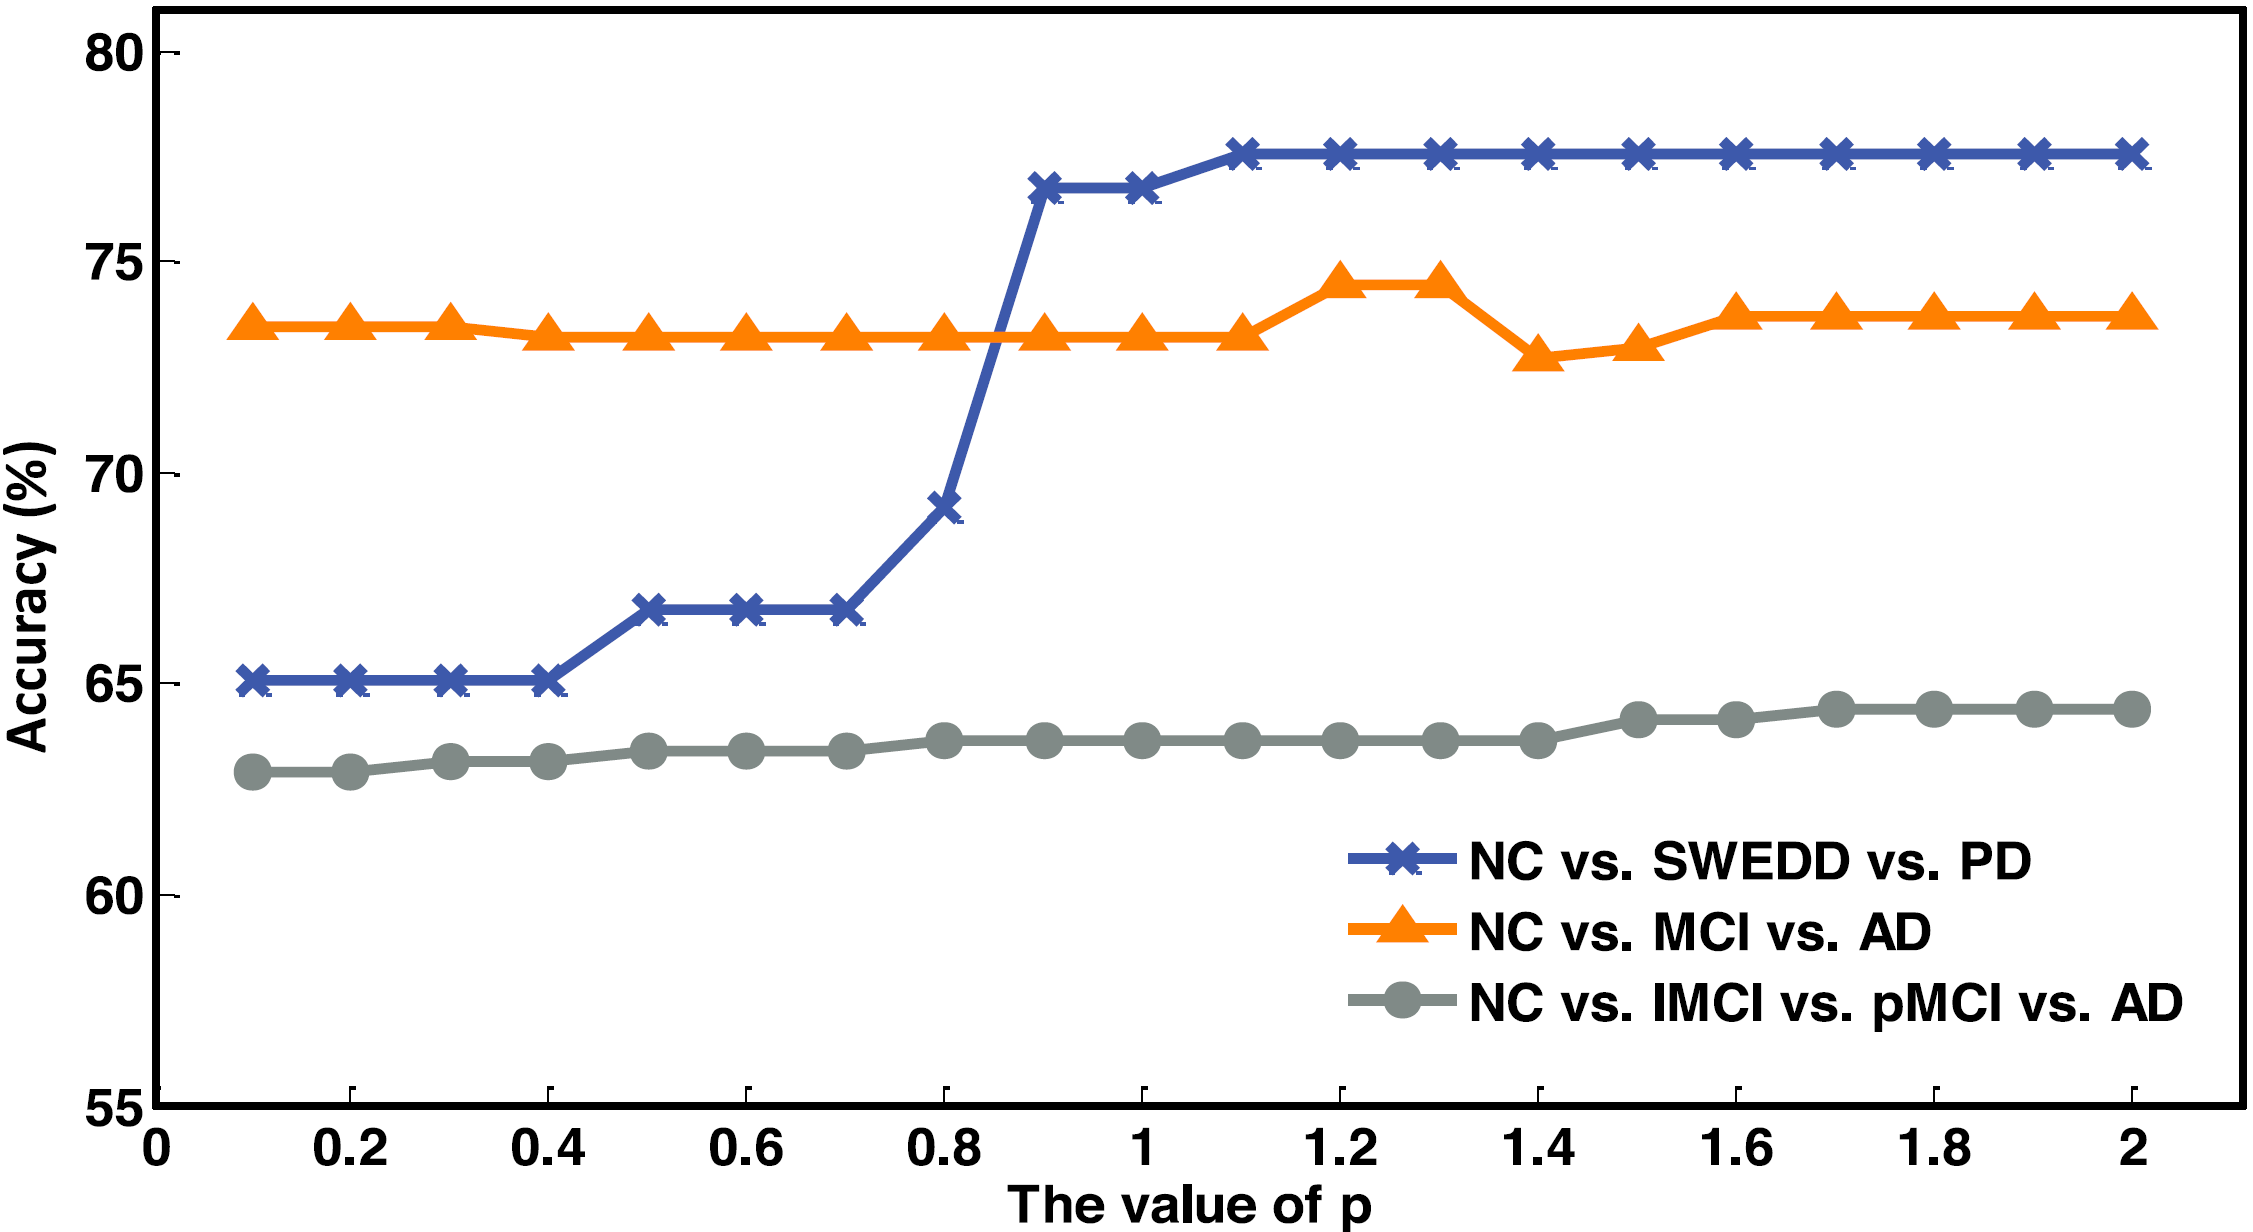
Fig. 7. Classification performance of our method ASL on different classification tasks with different p values using multi-ROIs fused features.

1111MicrosoftInternetExplorer402DocumentNotSpecified7.8 磅Normal0Fig. 8. Top 10 important brain regions, disease-related ROIs overall distribution from the NC. vs. PD.vs. SWEDD classification task (first row), NC vs. AD vs. MCI classification task (second row), NC vs. AD vs.lMCI vs. sMCI classification task (third row).
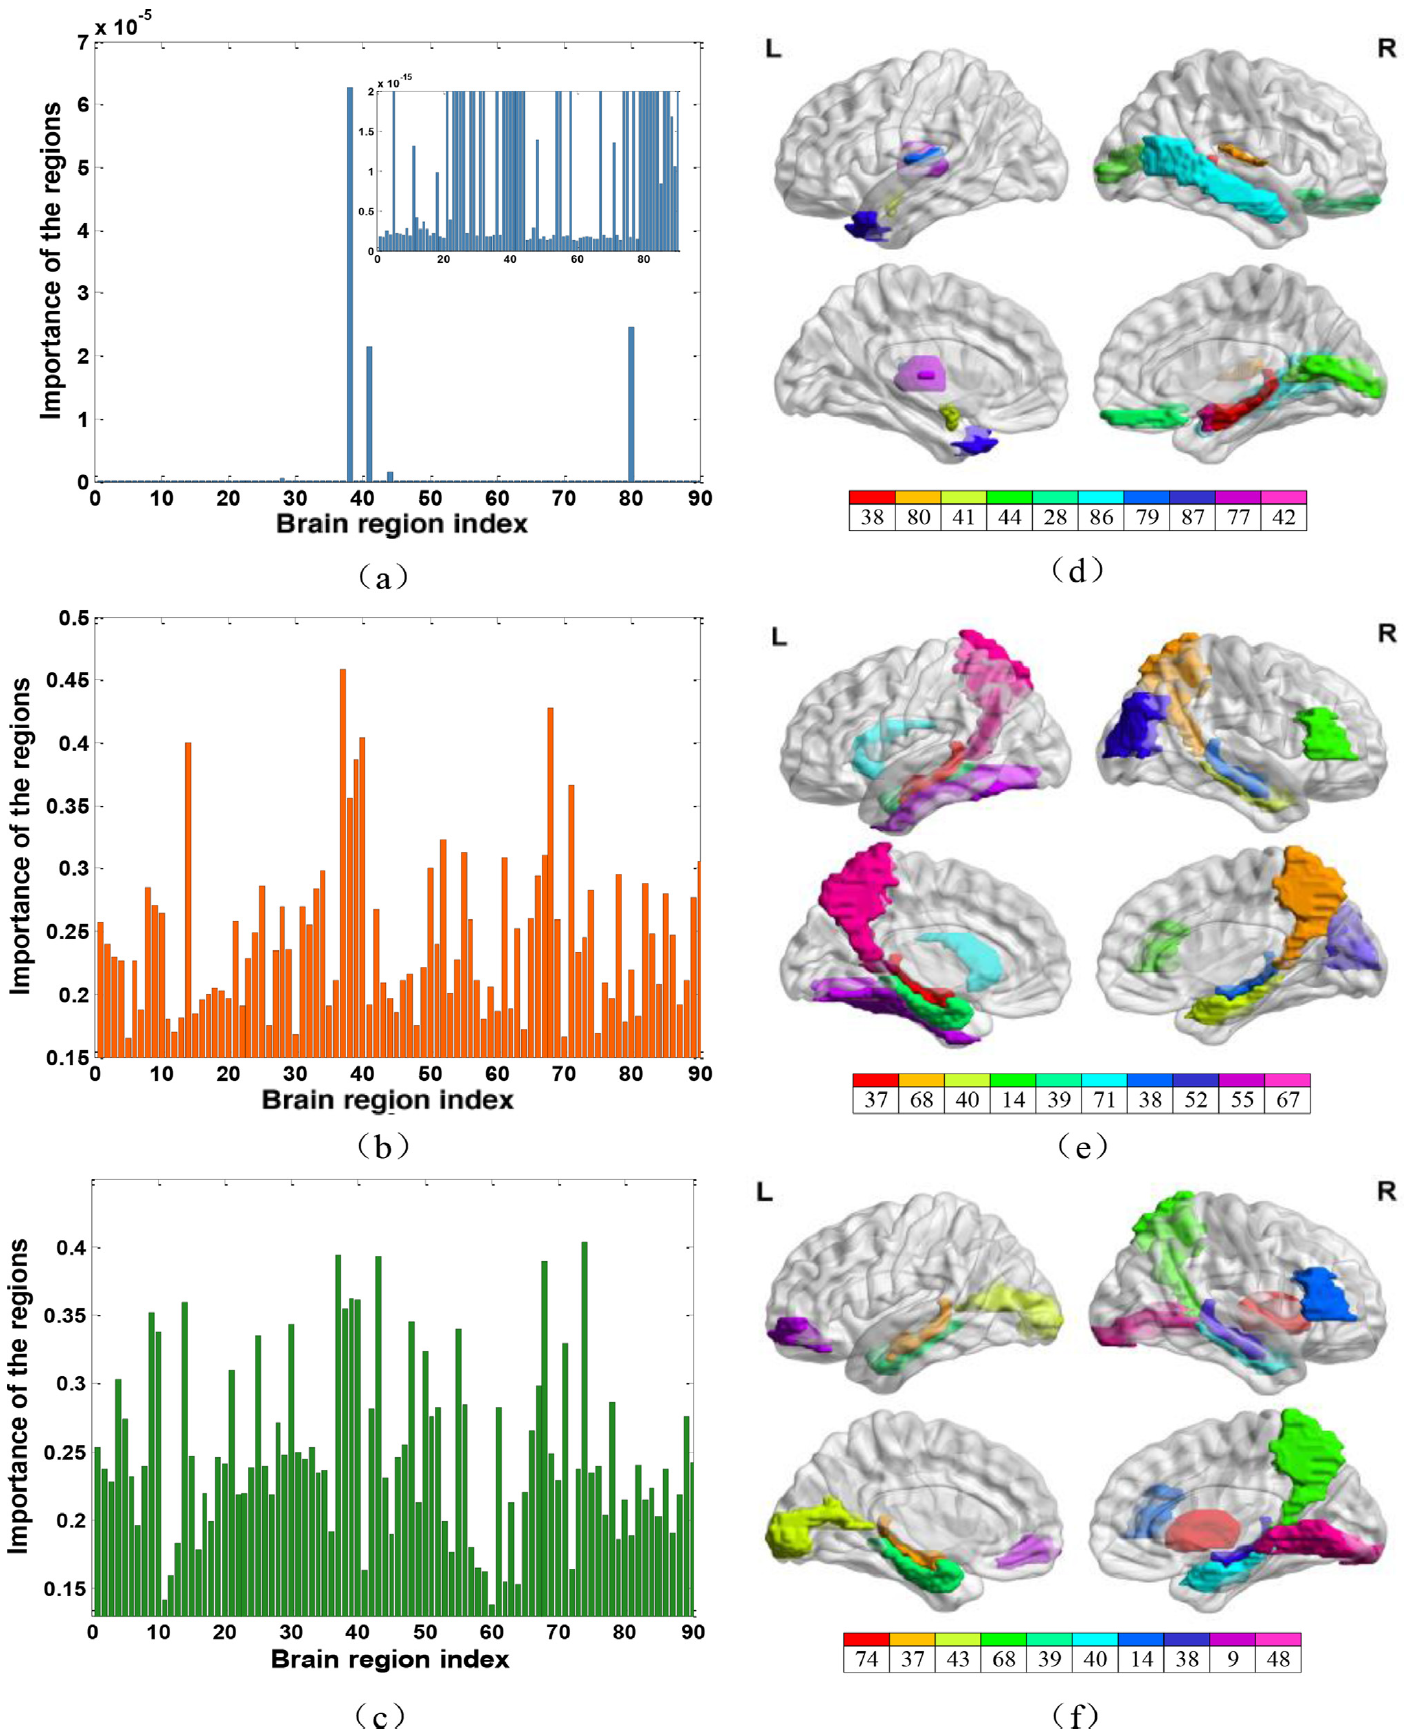
Fig. 9. The importance of 116 brain regions and selected top 10 disease-related ROIs from NC. vs. PD. Vs. SWEDD classification task (first row),NC vs. AD vs. MCI classification task (second row), NC vs. AD vs. lMCI vs. sMCI classification task (third row).The subfigure of (a) is the zoom of the original figure for better observation.
1111MicrosoftInternetExplorer402DocumentNotSpecified7.8 磅Normal0
1111MicrosoftInternetExplorer402DocumentNotSpecified7.8 磅Normal0

1111MicrosoftInternetExplorer402DocumentNotSpecified7.8 磅Normal0
Fig. 10. (a) Selected ROIs and their connections from NC vs. SWEDD vs. PD classification task with threshold 0.99. (b)Selected ROIs and their connections from theNC vs. MCI vs. AD classification task with threshold 0.95. (c)Selected ROIs and their connections fromNC vs. lMCI vs. sMCI vs. AD classification task with threshold 0.95.
1111MicrosoftInternetExplorer402DocumentNotSpecified7.8 磅Normal0
Acknowledgements
This work was supported partly by National Natural Science Foundation of China (Nos. 61871274, 61801305, 61806071 and 81571758), the Integration Project of Production Teaching and Research by Guangdong Province and Ministry of Education (No. 2012B091100495), Key Laboratory of Medical Image Processing of Guangdong Province (No. K217300003), Guangdong Province Key Laboratory of Popular High Performance Computers (No. 2017B03031407), Guangdong Pearl River Talents Plan (2016ZT06S220), Shenzhen Peacock Plan (Nos. KQTD2016053112051497 and KQTD2015033016 104926), Shenzhen Key Basic Research Project (Nos. JCYJ20180507184647636, JCYJ20170818142347251, JCYJ20170818 094109846, and JCYJ20170302153337765), Hong Kong Research Grants Council(No. PolyU 152035/17E), and Open Project Program of the National Laboratory of Pattern Recognition (NLPR) (No. 201900043).
Bibtex
@article{2020Adaptive,
title={Adaptive Sparse Learning using Multi-template for Neurodegenerative Disease Diagnosis},
author={ Lei, B. and Zhao, Y. and Huang, Z. and Hao, X. and Lei, H. },
journal={Medical Image Analysis}, volume={61},
pages={101632},
year={2020},
}
Downloads